The number is as good as the trace.
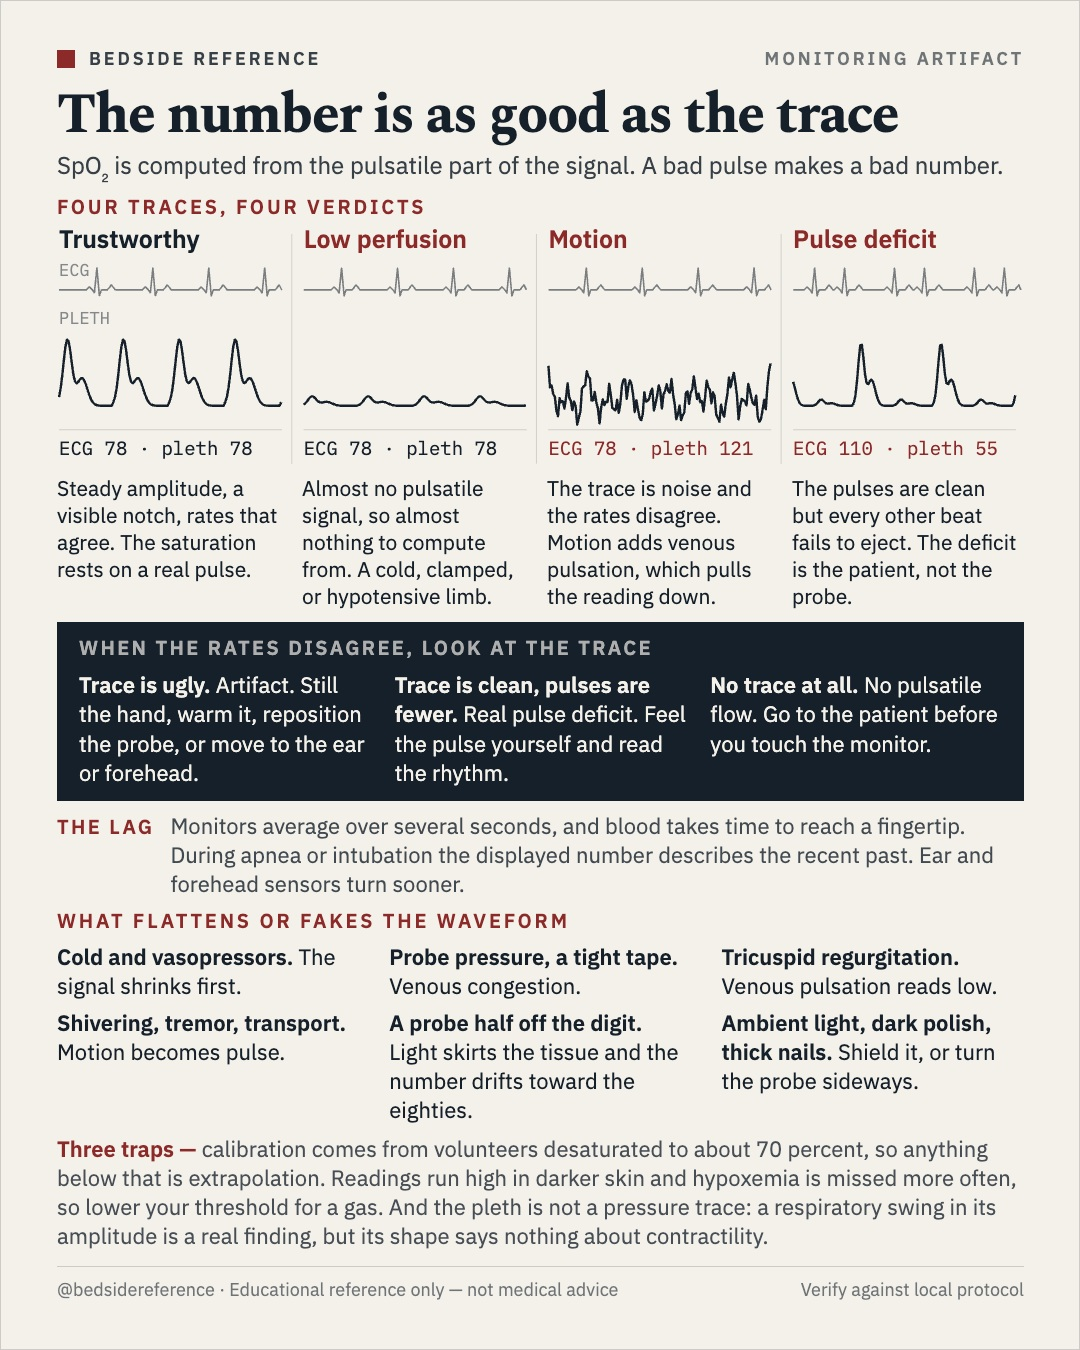
SpO₂ is computed from the pulsatile part of the signal. If the plethysmograph is noise, flat, or out of step with the ECG, the saturation is not a measurement.
Reviewed September 2026 · verify against current guidelines
The number is as good as the trace.
SpO2 is computed from the pulsatile part of the signal. A bad pulse makes a bad number.
Four traces, four verdicts
| Trace | Rates | Reading |
|---|---|---|
| Trustworthy | ECG 78 · pleth 78 | Steady amplitude, a visible notch, rates that agree. The saturation rests on a real pulse. |
| Low perfusion | ECG 78 · pleth 78 | Almost no pulsatile signal, so almost nothing to compute from. A cold, clamped, or hypotensive limb. |
| Motion | ECG 78 · pleth 121 | The trace is noise and the rates disagree. Motion adds venous pulsation, which pulls the reading down. |
| Pulse deficit | ECG 110 · pleth 55 | The pulses are clean but every other beat fails to eject. The deficit is the patient, not the probe. |
When the rates disagree, look at the trace
- Trace is ugly. Artifact. Still the hand, warm it, reposition the probe, or move to the ear or forehead.
- Trace is clean, pulses are fewer. Real pulse deficit. Feel the pulse yourself and read the rhythm.
- No trace at all. No pulsatile flow. Go to the patient before you touch the monitor.
The lag
Monitors average over several seconds, and blood takes time to reach a fingertip. During apnea or intubation the displayed number describes the recent past. Ear and forehead sensors turn sooner.
What flattens or fakes the waveform
| Cold and vasopressors | The signal shrinks first. |
|---|---|
| Shivering, tremor, transport | Motion becomes pulse. |
| Probe pressure, a tight tape | Venous congestion. |
| A probe half off the digit | Light skirts the tissue and the number drifts toward the eighties. |
| Tricuspid regurgitation | Venous pulsation reads low. |
| Ambient light, dark polish, thick nails | Shield it, or turn the probe sideways. |
Educational reference only — verify against local protocol.
Sources
Verify against current guidelines and local protocol before acting.
- Jubran A. Pulse oximetry. Crit Care 2015;19:272.
- Chan ED, Chan MM, Chan MM. Pulse oximetry: understanding its basic principles facilitates appreciation of its limitations. Respir Med 2013.
- Sjoding MW, et al. Racial Bias in Pulse Oximetry Measurement. NEJM 2020.
- Cannesson M, et al. Respiratory variations in pulse oximetry plethysmographic waveform amplitude to predict fluid responsiveness. Anesthesiology 2007.
Downloads
Every card for this topic — carousels and tables, print-ready for the wards or for sharing.